www.thewindop.com new LoRaWan wind meter is under test. This post deals with how to visualise data for debug/interest during the early days of using sensors on TheThingsNetwork(TTN).
Firstly you need a TTN account with data being streamed to the site. You also need to enable SWAGGER which will let you pull up to a weeks device data from the site.
We created three simple scripts (SeeGitHub) to help us in this process, plus one JupyterLab notebook.
Step 1: Data is received as a JSON formatted data string with the RAW data BASE64 encoded. For initial debug we generated a PERL helper to
- generate the CURL request to TTN
- Decode the BASE64 RAW data packet
- Unpack the data strings into WindOp data packets
- Save the data to a CSV
For this script to work you need to provide your TTN authorisation key and the Swagger App path. Put these in a file somewhere on your filesystem and pass as a script argument.
To see you device handles use, you will need to pass a file with you TTN authKey and path.
s1_wm_ttn_fetchUnpack.pl -list
You should see something like
   Avaiable devices are: (JSON List returned)

["00","01"]
Run the data fetch.
s1_wm_ttn_fetchUnpack.pl -sel 00 -dur 10m -dump
Using -dump you should see the data string returned in its pure form.
[{"device_id":"00","raw":"BQ4OEhl+UwAAAAAA3Qw=","time":"2017-09-02T08:14:14.787613318Z"}]
You will also see the decoded version as a string and a byte array. Note this is simply a dump of the PERL hash that holds the unpacked and processed JSON string returned.
$VAR1 = [
          {
           'device_id' => '00',
            'bytes' => [5,14,14,18,25,126,83,0,0,0,0,0,221,12],
            'time' => '2017-09-02T08:14:14.787613318Z',
            'raw' => 'BQ4OEhl+UwAAAAAA3Qw=',
            'decoded' => '050e0e12197e530000000000dd0c'
          }
        ];
To run the windOp packed decode add the runWm switch. This will produce a CSV for review of decoded packet data with headings for the each reading.
s1_wm_ttn_fetchUnpack.pl -sel 00 -dur 10m -runWm
Step 2: After a few hours/days we have multiple CSV files. We wrote a basic merge utility to merge all CSV files in a directory into a single file. Repeats of the same time are ignored. Arguments are the directory contains all the CSV files and an output filename.
This allows merging of multiple CSV which may have overlapping data points. Overlaps are discarded.
s2_wm_csv_merge.pl -in ./windop/ttn/wmOutData/ -o t1.csv
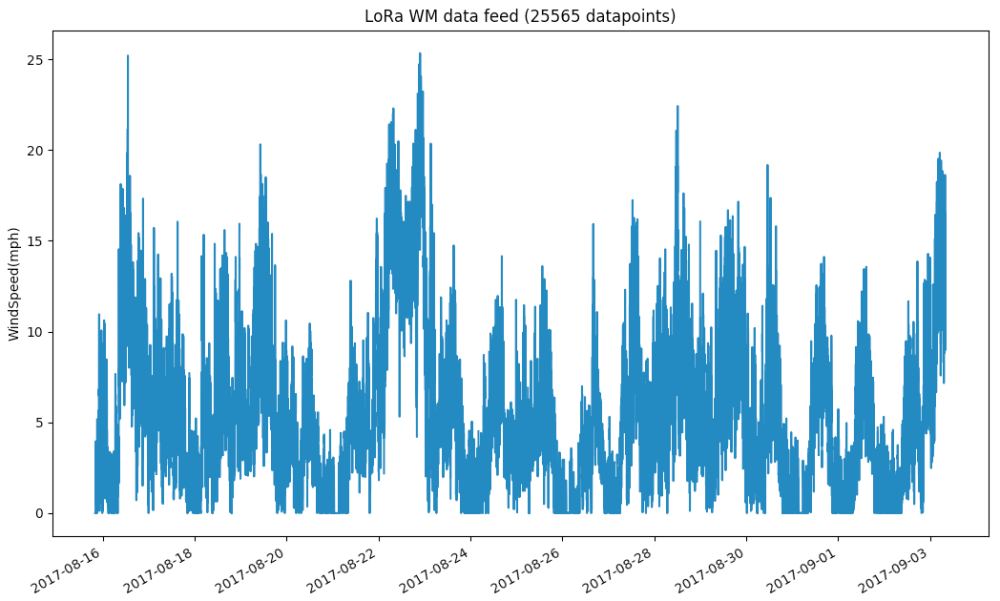
Step 3: Plot the data. Here we use Python and MATPLOT lib as the plots look awesome. This was ran using the Anaconda Python distribution, which JupyterLab also works well with.
python s3_wm_csv_plot.py -c t1.csv
You should now see a chart that looks similar to that below.
You can also experiment with the data in Jupyter Lab. The same script run above can be used to experiment with the data inside a Jupyter notebook.
This example demonstrates how to:
- Read a CSV data file using Pandas
- Access the data array
- Convert the time string to DateTime objects
- Constrain a time series plot of the data & display it

In summary we have a demonstrated a method for recovery of data from TTN, data decode, logging to an intermediate file format and visualisation using Python. Further analysis can also be performed in Python, ideally in Jupyter Lab.

One thought on “cAno2, LoRa & TheThingsNetwork”